Satellite algal bloom monitoring, reading chlorophyll from space
If you manage lakes or drinking water intakes, the widest early view of blooms across the whole water body comes from satellite algal bloom monitoring.
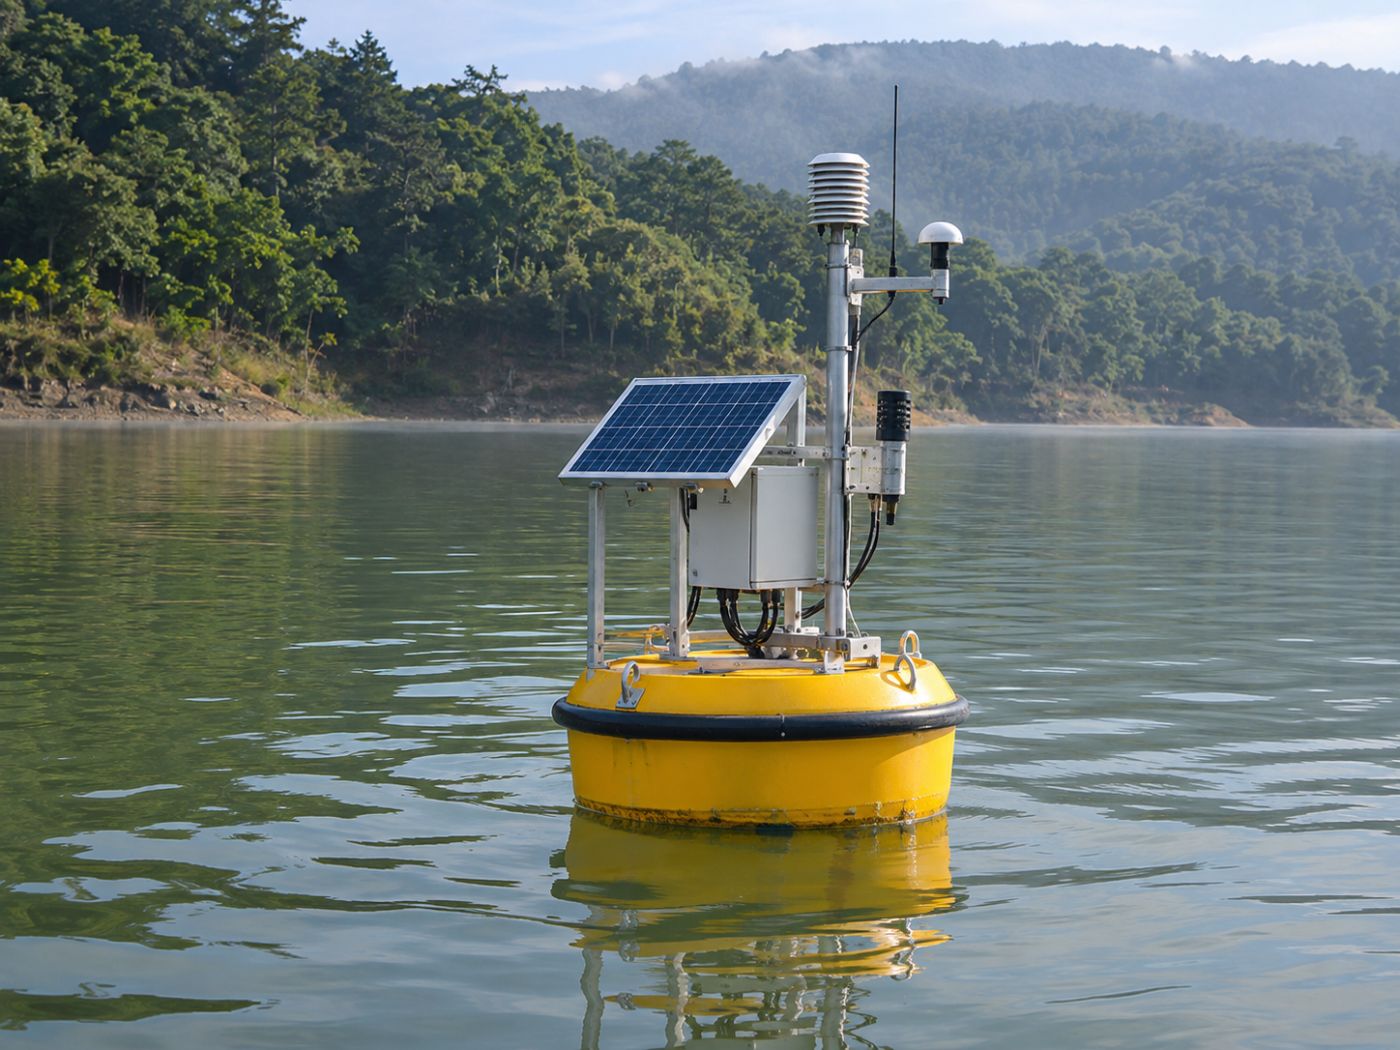
Bloom teams usually learn about a bloom in one of two ways: a sample taken at a fixed point on a fixed day, or a rising value at an automatic station. Both are accurate, but they describe only a few points on a large lake.
Blooms often start between those points: in a bend where water flows in, along a shore where wind piles it up, or in a quiet inlet. They thicken there first and can spread widely within days.
Below we explain how satellites read blooms from water colour, the limits you should know, how results are checked against field data, and what BASIN adds. If you are considering satellite monitoring for your water, read on.
Category: Algal bloom monitoring
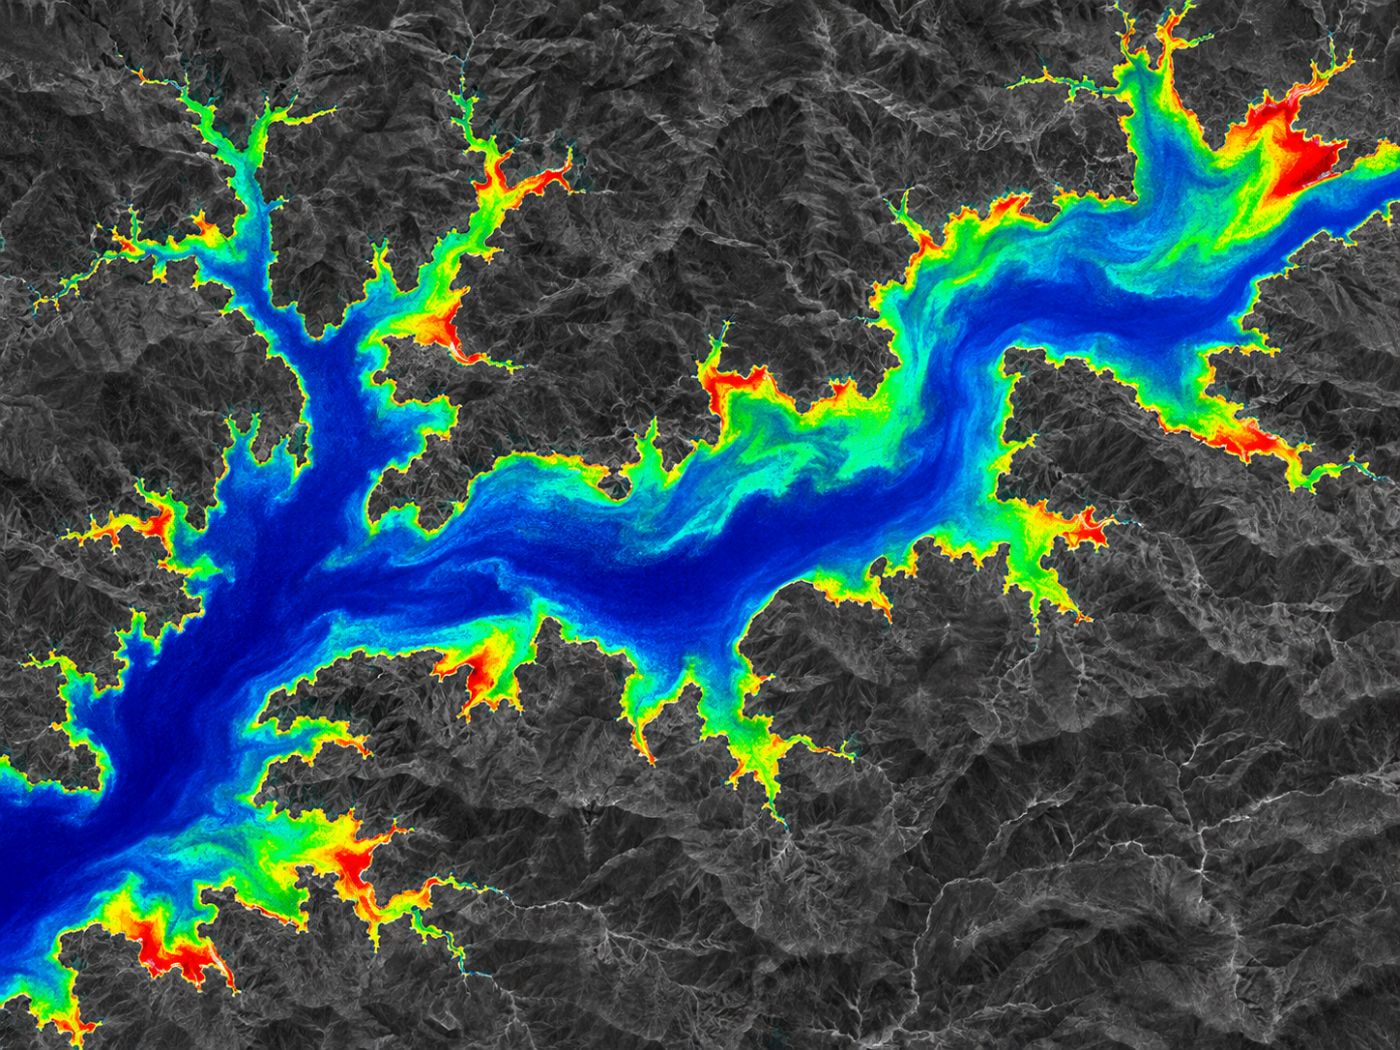
Satellite algal bloom monitoring estimates chlorophyll-a from shifts in water colour
Phytoplankton contain a pigment called chlorophyll-a. As blooms grow, so does chlorophyll in the water, and the way water reflects light changes, most clearly at the red edge between red and near-infrared light.
The Copernicus Sentinel-2 mission images this red-edge range in separate bands, revisits the same place about every five days and has a resolution of 10 m, enough to divide even a large lake into cells.
The Normalised Difference Chlorophyll Index (NDCI) turns the difference between red-edge and red bands into an index. It was proposed for estimating chlorophyll in turbid inland waters and is described in Mishra and Mishra (2012).
BASIN calculates NDCI from atmospherically corrected Sentinel-2 images (L2A), estimates chlorophyll-a and sorts each cell into four levels: clear, watch, alert and bloom. As scenes accumulate, it also shows whether concentration is rising or falling.
How a satellite turns water colour into a bloom map
Sentinel-2 images the same lake about every five days.
L2A images remove atmospheric effects.
Red-edge and red bands give a chlorophyll-a estimate.
Each 10 m cell is rated clear, watch, alert or bloom.
Cloud and shorelines are the walls satellite analysis has to climb
Optical satellites record reflected sunlight, so they cannot see water under cloud. Bloom season is often also the rainy season, and some scenes cannot be used.
Shorelines are tricky too. When one cell mixes water, land and shore plants, chlorophyll can look higher than it is. In a drought, yesterday’s shoreline can be today’s dry lake bed.
That is why BASIN builds a separate daily water surface from Sentinel-1 radar, which is not affected by cloud. Calm water looks dark in radar, so water and land can be separated in any weather.
Cloudy scenes are not forced into use. Instead, BASIN continues with the conditions behind blooms (temperature, nitrogen, phosphorus, sunlight and residence time) and weather forecasts.
Satellite algal bloom monitoring needs field measurements to be trusted
Satellites read the colour near the surface. How much of the chlorophyll comes from cyanobacteria, and how it varies with depth, can only be confirmed by sampling.
The World Health Organization’s guidance on toxic cyanobacteria in water treats remote sensing as a tool that helps monitor large water bodies, while decisions are made together with field samples.
In Korea, monitoring network and algae data are published through the Water Environment Information System. Each time new measurements arrive, BASIN compares them with its satellite results and recalculates error, correlation and alert recall.
BASIN adds the days ahead to today’s map
A satellite bloom map shows where water is green today. What response teams really want to know is where it will thicken in the coming days and when it will reach the intake.
BASIN calculates a growth rate from the five bloom drivers, adds weather forecasts and issues alert levels 3 to 7 days ahead every day. It also draws spread paths from wind and flow and gives the expected arrival date at each intake.
BASIN currently runs its own pilot monitoring of five Korean water bodies from public satellite data: Paldang, Daecheong and Soyang lakes, the Nakdong River (Mulgeum, Maeri) and Saemangeum Lake. Accuracy figures will follow an official pilot.
That covers how satellites read chlorophyll-a, their limits and how they are validated; BASIN’s bloom map is described in detail on the algal bloom map page.
Frequently asked questions
Can satellites see cyanobacteria alone?
Optical satellites mostly see the overall phytoplankton signal, such as chlorophyll-a. The amount and type of cyanobacteria are confirmed by sampling.
Do the satellite images cost money?
Sentinel-1, Sentinel-2 and Landsat images are free and open, so data costs hardly grow as you add water bodies.
Can small reservoirs be monitored?
With 10 m cells, narrow water bodies are strongly affected by shoreline cells. We test first and decide based on the size and shape of the water body.
Want to see your reservoir or intake from above first?
We can start with a satellite screening of your water bodies and compare it with your own field records.
Discuss a pilot →Edited and answered by the MomentCube BASIN team / james@momentcube.com · +82-32-212-1011